Displaying Strain Data
[ Contour Display ] [ Gradient Display ] [ Contour Model ]
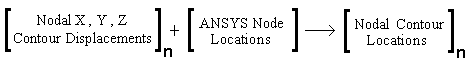
The nodal displacements corresponding to the strain contour were added to the original node locations for each time step.
|
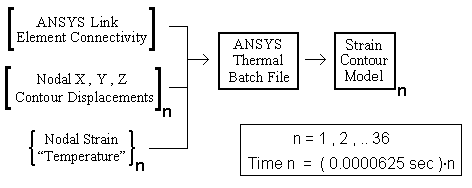
The nodal locations for the strain contour and the nodal "temperatures" for the strain color gradient were used to make a model for each time step.
 |
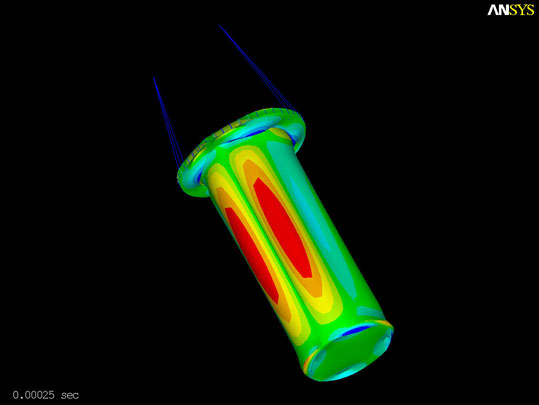
A picture of each model was used as a frame to animate the motion for each
movies. Here is an example of a frame from the movie:
 |
 |
|
Time = 0.00025 Seconds
|
|