Displaying Strain Data
[ Contour Display ] [ Gradient Display ] [ Contour Model ]
ANSYS was chosen because of the versatility of its display package. Two methods were chosen to display the hoop strain data on the cylinder model; as a contour and as a color gradient.
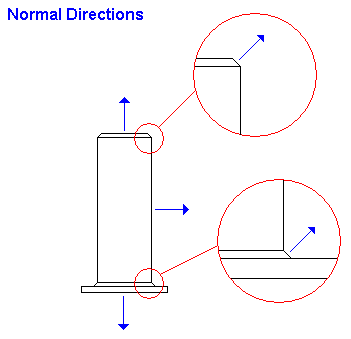
To display the strain data as a contour, models were built with nodal displacements, normal to the cylinder surface and proportional to the hoop strain values. These normal directions are displayed below:
|
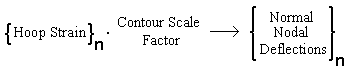
To use the strain values as normal deflections, they were scaled such the the model could have visible contours with out effecting model continuity.
 |
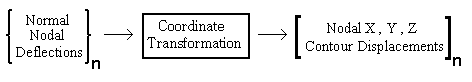
These normal deflections were transformed into the appropriate Cartesian coordinates.
 |