Application
User's Manual
Macro Code
User's Manual
Macro Code
Application
This application can be used to reproduce the graphs given in class (planar view and three axis view) and also to generate others (that I called constant radius 3D view). It is a useful tool in the learning and research processes related to the wave propagation phenomena in anisotropic materials.
The name of this application is PhaseVelocities.xls. It will continue helping to improve a personal understanding and hopefully this work will also be useful to other people.
PhaseVelocities.xls is available to everyone who wants to use, modify or improve it. Just refer the work properly. At this point, the application is not free of errors and in fact there are many things that can be done to improve it. The work is based in the
Wave Propagation Course
at VT
(see AllAbout)
given by Professor Ronald Kriz.
User's manual
As a first recommendation, before open PhaseVelocities.xls, make a back up of this file. There are three macros included and if for example some cells are inserted or deleted in some tabs of the excel screen, the macros will not work properly and as a consequence the results will not be right.
PhaseVelocities.xls allows the user to get the phase velocity propagation graphs for any anisotropic material with known stiffness constants.
The program used to generate this application is Excel. Open the xls file, it will appear the following warning window:
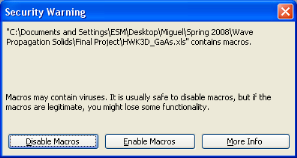
Choose the Enable macros option. Run the application by clicking in the following link:
PhaseVelocities has nine tabs: Material, Angles, MainPlanar, Main3D, VelocitiesPlanar, Velocities3D, Visual 3D correction, ResultsPlanar and Results 3D.
The Material tab basically contents the information about the stiffness constants and the density of the material and also the desired phi angle for the calculations.
The Angles tab has a fixed stablished values for theta (from 90 to -270 degrees, every 5 degrees) and a dependent value for phi for the calculations in the three 3D approach (from the phi+90 to phi degrees).
The MainPlanar tab does the calculations of the velocities and their directions for the planar representation.
The Main3D tab does the calculations of the velocities and their directions for the 3D representation.
The VelocitiesPlanar tab is a summary of the results from the MainPlanar tab.
The Velocities3D tab is a summary of the results from the Main3D tab.
The Visual 3D correction tab does an approximate transformation of the data to a 3D representation for the 3 Axis View. It cannot be done directly in Excel.
The ResultsPlanar tab shows the Phase Velocities Planar graph for the selected material and phi.
The Results3D tab shows the Phase Velocities 3D graphs (constant radius view and 3 axis view) for the selected material and phi.
WHAT THE USER HAS TO DO to get the results is not complicated and can be summarized in the following points:
1. Choose a material in the Material tab. To do this, write the number that corresponds to the material list in the box next to the bottom "choose", press Enter and click the button "choose". If the information is automatically copied in the black numbers separate box, the first step is done. If some material information needs to be modified or added, do this in the BLUE numbers. The table can be filled with new materials of particular interest. The button "Choose" internally runs a simple macro to copy the corresponding lines in the row number 10.
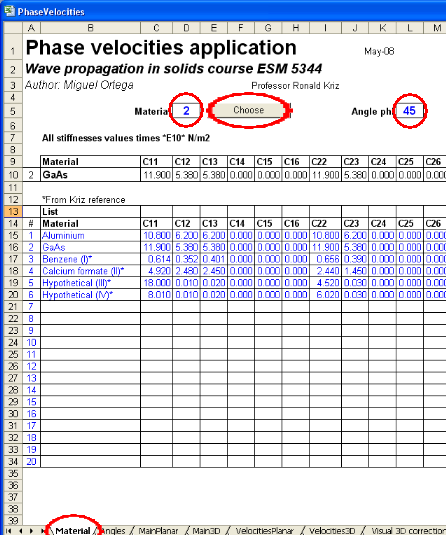
2. Choose the desired angle phi. Put the value in the corresponding box in the Material tab and press Enter.
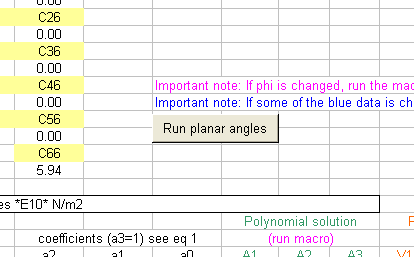
3. Pick the MainPlanar tab and press the button "Run planar angles". The macro "mol01" (see code below) runs and the values in the columns A1, A2 and A3 of the MainPlanar tab are calculated.
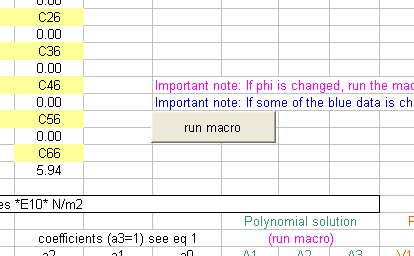
4. Pick the Main3D tab and press the button "run macro". The macro "mol01" (see code below) runs again and the values in the columns A1, A2 and A3 of the Main3D tab are calculated.
The results are ready in the ResultsPlanar and Results3D tabs.
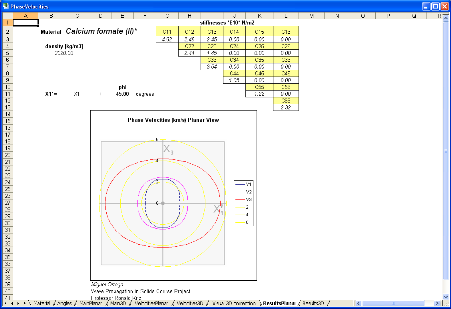
ResultsPlanar tab screen.
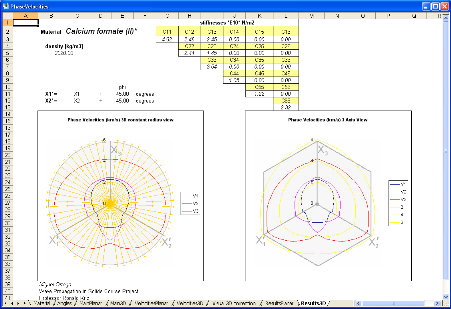
Results3D tab screen.
As a recommendation, never modify values or formulaes that were not set in BLUE in the original PhaseVelocities.wks.
Macro Code
The eigen values can be found by applying the Newton-Raphson method. It was done as a macro in Basic of Excel under the following code:
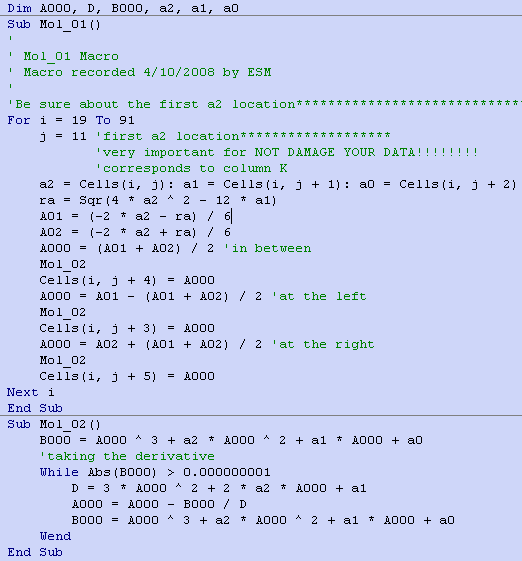
The three roots are internally evaluated as A000 in the code, and they are stored in the cells (i,j+3), (i,j+4) and (i,j+5) in order the first one is lower (or equal) to the second, and the second lower (or equal) to the third.