|
|
PV-Wave is a complete user friendly visualization enviroment
where the user can create custom oriented modules relatively easily.
The focus of our effort was to exploit and take
advantage of as many capabilities of the program as possible.
In that scope a series of modules and controls were developed
to accomplish each data reduction and visualization task.
Here we present these tools including the program
interface so that it's functionallity can be demonstrated.
The first set of tools accomplishes animation of the corresponding graphs
in the time domain.
|
|
|
|
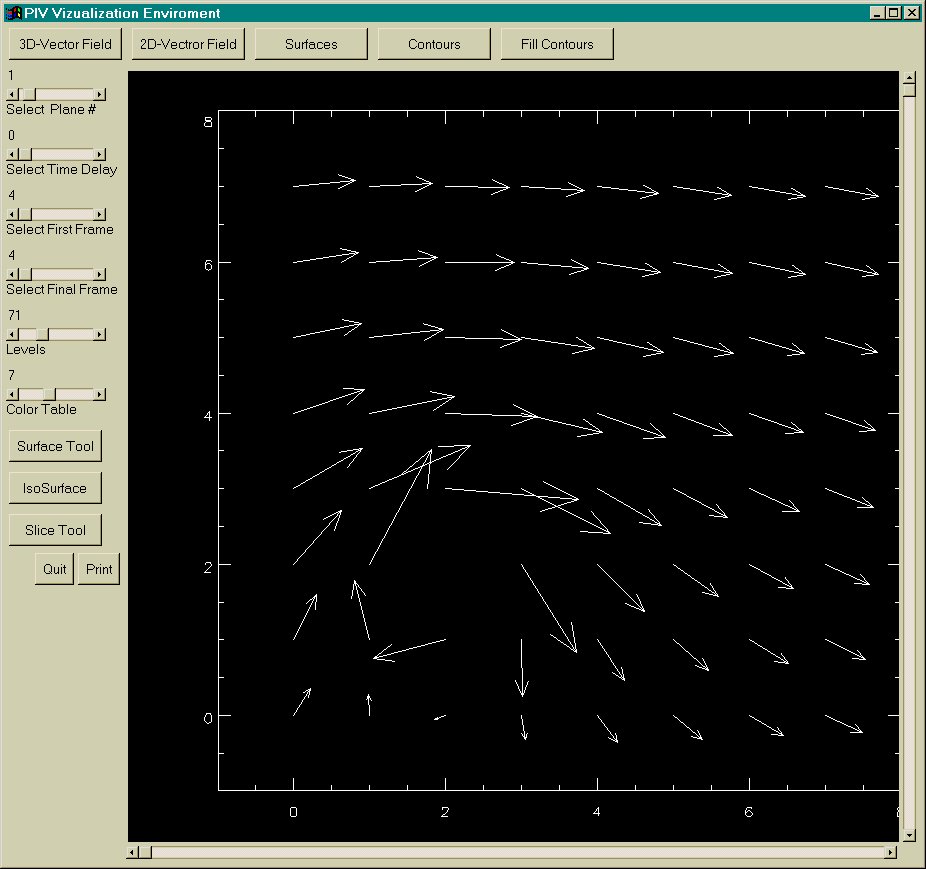
2D Vetrors Visualization
Two-dimensional plane velocity vectors resulting from an
ideal vortex entering the flow field and interacting with the free stream.
|
|
|
|
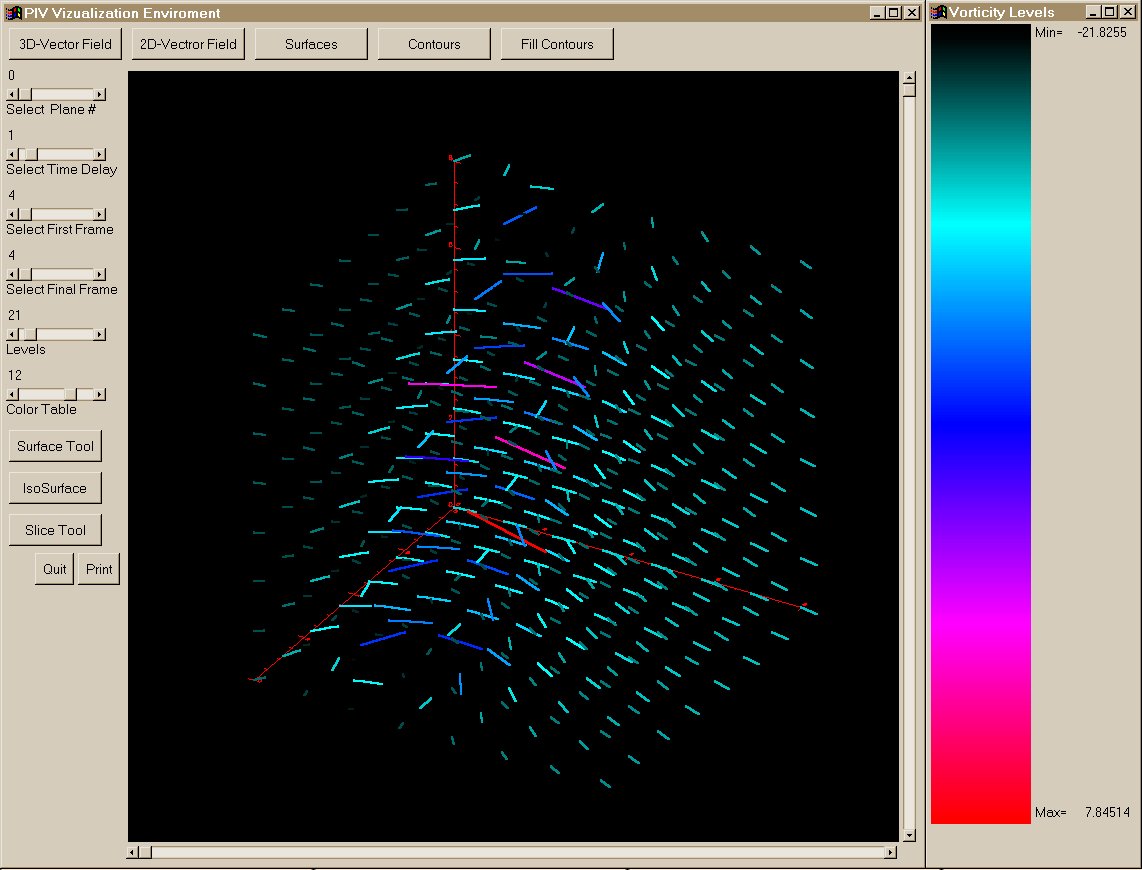
3D Vetrors Visualization
Representation of the three-dimensional
velocity vectors for the total volume at a specific time.
The volume can be animated in time so as to give a complete
representation of the evolution of the three-dimensional effects.
The colors reperesent the vorticity value of the corresponding grid location.
|
|
|
|
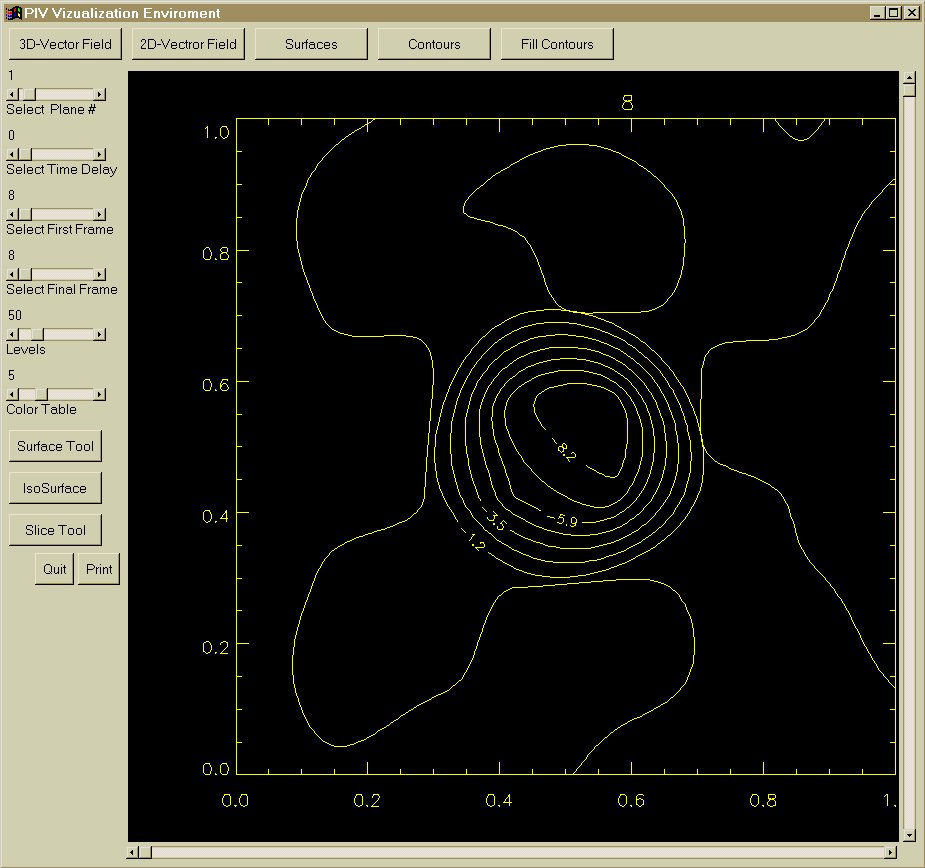
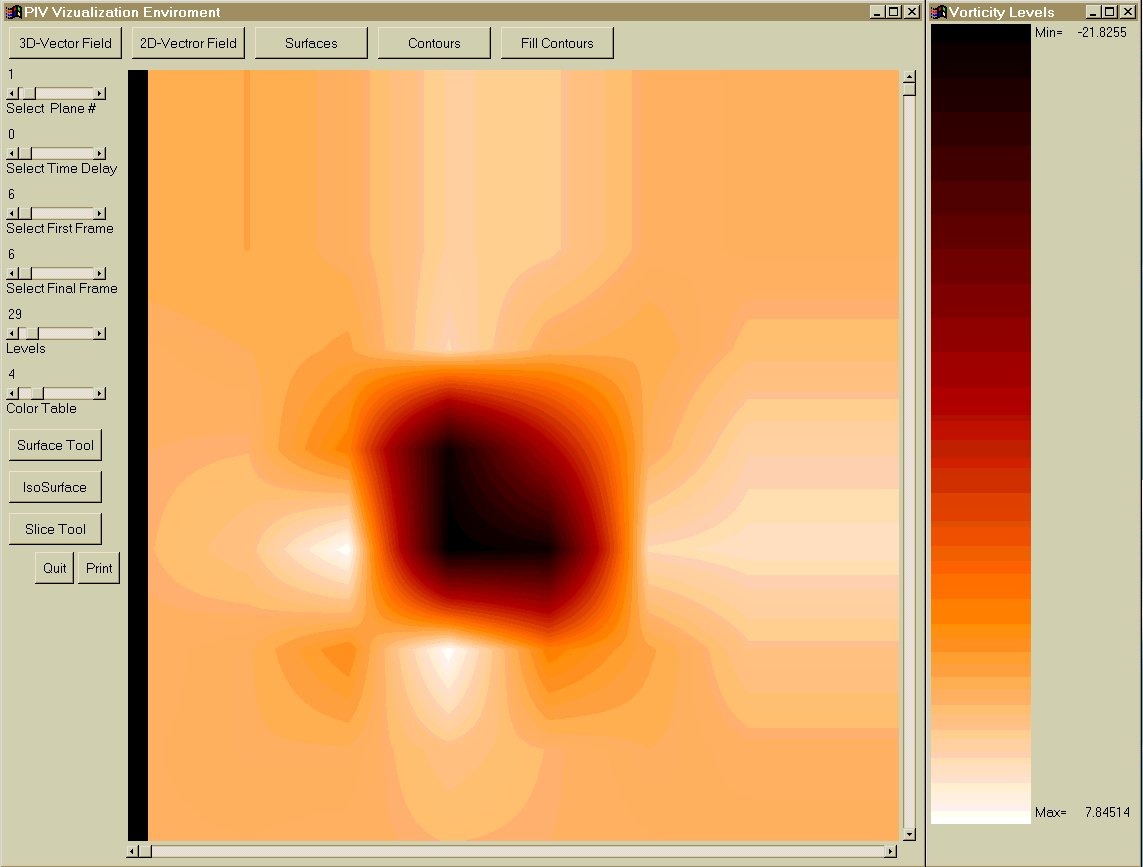
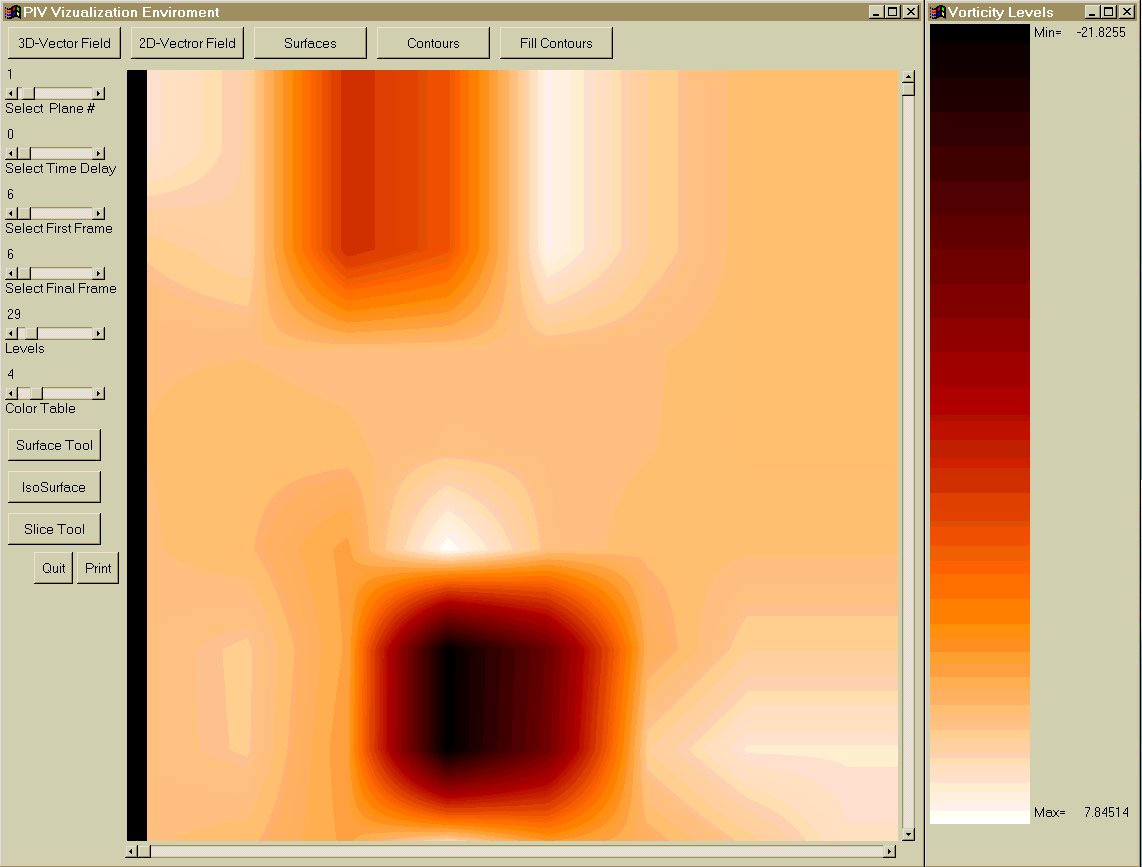
Vorticity contour plots
Contours corresponding to the same value
of vorticity give a very clear view of how the core of the vortex
propagates and deforms in time and space. This representation allows the user to
see how vorticity is distributed and diffused in the flow field.
|
|
|
|
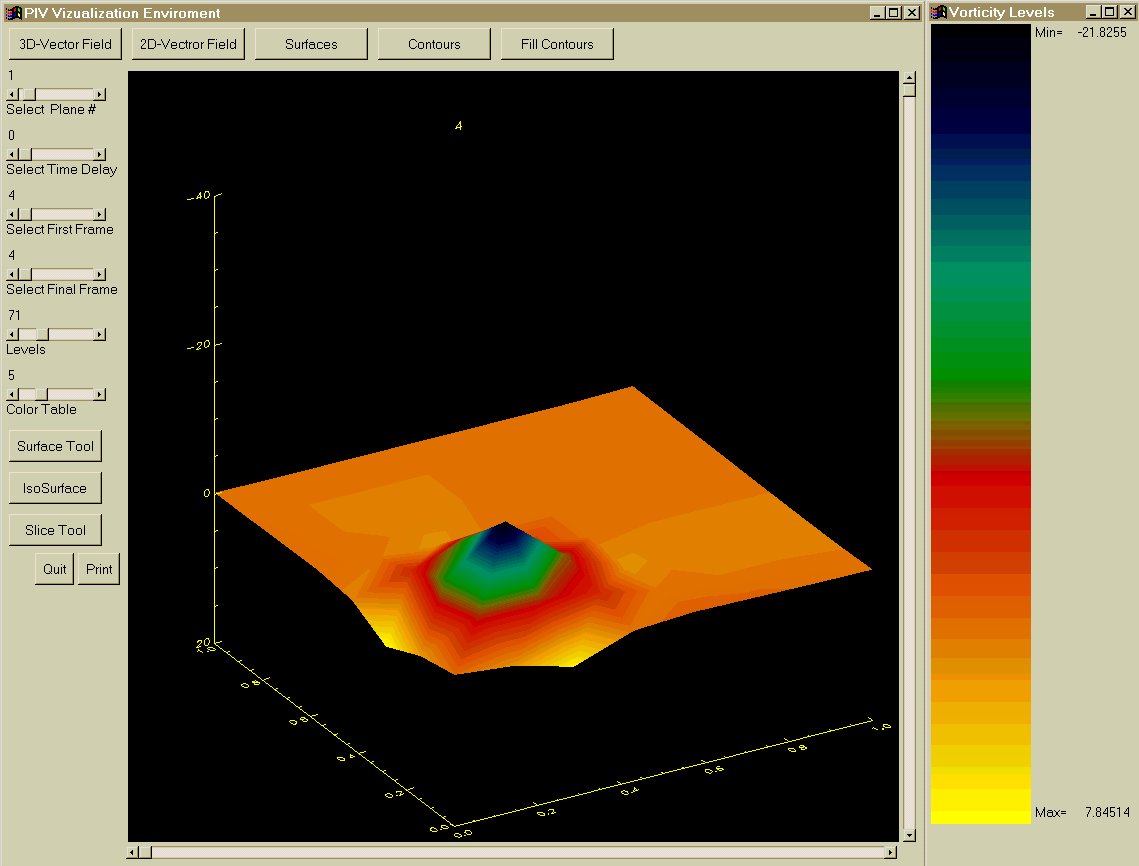
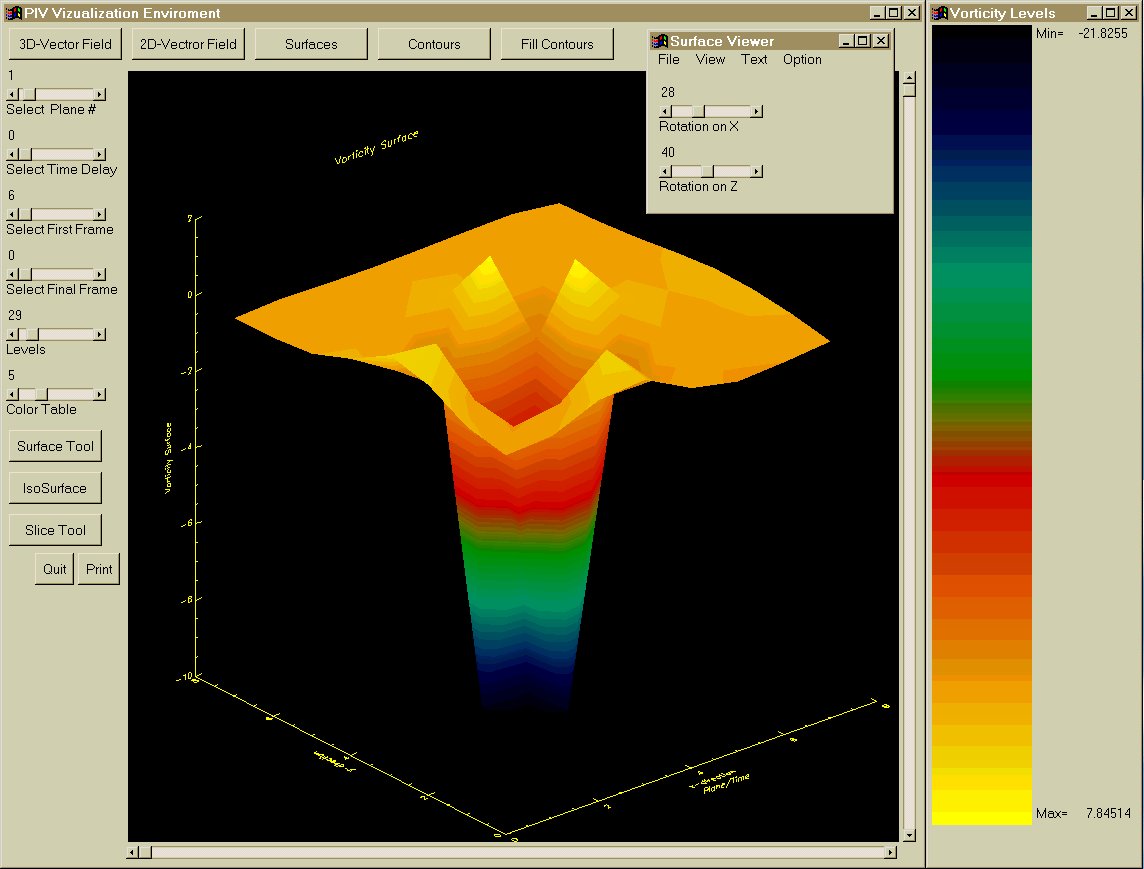
Vorticity Surface plots
Surface plots of vorticity can be very
useful in determining the time and area where generation of
secondary vorticity takes place.
|
|
|
The following set of tools allow manipulation of a static
data set giving different ways of viewing.
|
|
|
|
Surface Tool
With this option we able to
manipulate a vorticity surface plot, rotate it to obtain
different views and plot it also as a
grid or points. One can easilly observe that multiple view angles can lead
us to more complete understanding of the data.
|
|
|
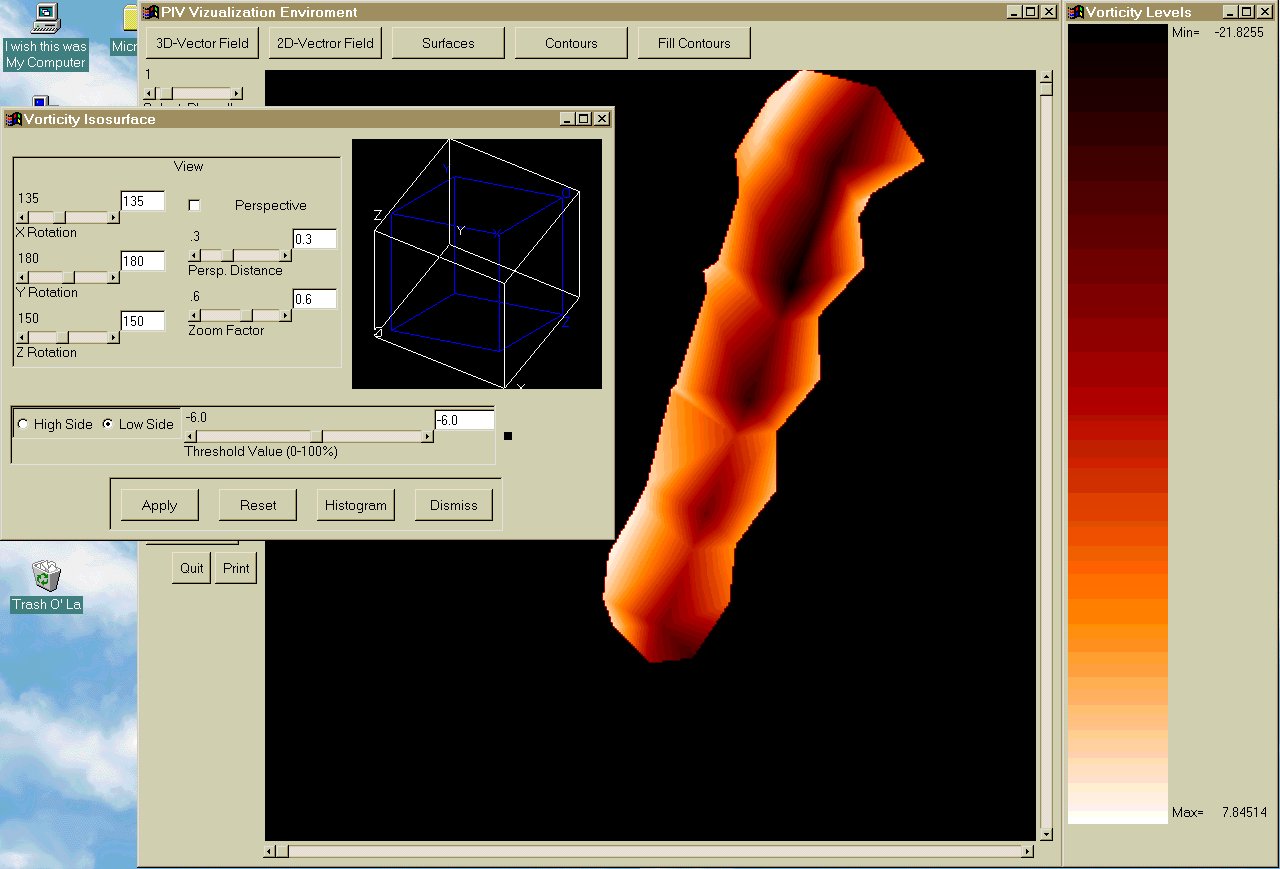 |
Iso-Surface Tool
Iso-surfaces of vorticity inform us
about the way a vorticity value is distributed
within the volume. These surfaces can reveal the existence of instabilities in the flow
structure and eventually breakdown. The implementation of several
controls on the interface make this kind of investigation easier and more powerful.
|
|
|
|
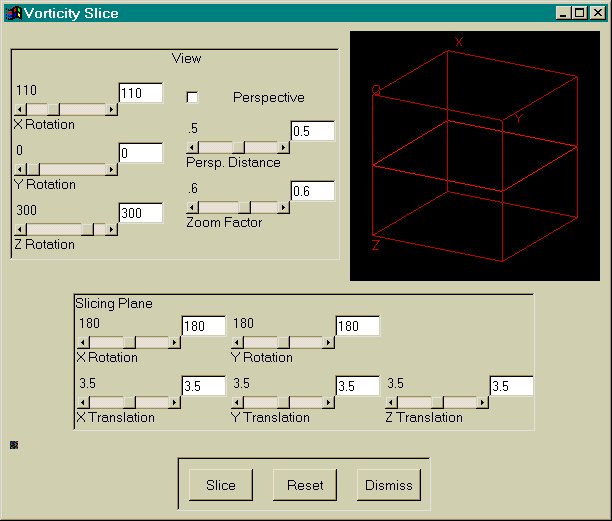
Slice Tool
In most cases a vortex is not
perpendicular but is tilted at an angle detremined by the flow environment.
The ability to control the XYZ level and orientation
of a slice plane makes this a very flexible tool to attack this kind of situation. Again
the distribution of vorticity will help us determine whether or not vortex instabilities
exist and their location.
|
|
|
|
All the related PV-Wave programs can be downloaded
here
|